你还在苦苦分析Spring Boot 启动错误堆栈,而不是使用故障分析器吗? --20210712

大家好, 我是指北君。

相信大家在启动 Spring Boot 项目的时候,也遇到过由于各种各样的原因而启动失败的情况吧,显示出一大堆的错误信息,比如端口占用时会打印如下异常:

1
2
3
4
5
6
7
***************************
APPLICATION FAILED TO START
***************************
Description:
Embedded servlet container failed to start. Port 8080 was already in use.
Action:
Identify and stop the process that's listening on port 8080 or configure this application to listen on another port.

相信大家应该很熟悉吧,多少遇到过这种情况吧。 错误信息大家都能看懂,但是不太友好。今天指北君就来带大家看看 Spring Boot 是怎么实现这样一个异常错误信息输出的呢?给大家分享一个 Spring Boot 启动失败的简单易懂的玩法,能够让大家轻而易举的看出问题所在之处。

FailureAnalyzer 介绍

通过端口重复绑定的异常信息的输出,指北君找到了具体输出的类 PortInUseFailureAnalyzer 。

1
2
3
4
5
6
7
8
9
class PortInUseFailureAnalyzer extends AbstractFailureAnalyzer<PortInUseException> {
    @Override
    protected FailureAnalysis analyze(Throwable rootFailure, PortInUseException cause) {
        return new FailureAnalysis("Web server failed to start. Port " + cause.getPort() + " was already in use.",
                "Identify and stop the process that's listening on port " + cause.getPort() + " or configure this "
                        + "application to listen on another port.",
                cause);
    }
}

PortInUseFailureAnalyzer 继承了 AbstractFailureAnalyzer 类。 而且可以看出该类是针对 PortInUseException 异常的分析。

spring boot failure1

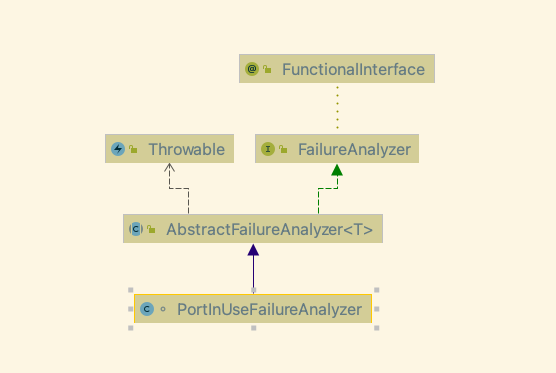
我们来看看 Spring Boot 提供的 FailureAnalyzer 接口,只定义了 一个annlyze 接口。 好像和 PortInUseFailureAnalyer 中的 analyze 方法不太一样,怎么回事呢?

1
2
3
4
@FunctionalInterface
public interface FailureAnalyzer {
   FailureAnalysis analyze(Throwable failure);
}

相信大家也很容易就能想到, AbstractFailureAnalyzer 对 FailureAnalyzer 进行了封装处理,使得其他个性化的错误可以自由发挥,能够暴露出更多的错误信息。

1
2
3
4
5
6
7
8
9
10
11
12
13
14
15
16
17
18
19
20
21
22
23
24
25
public abstract class AbstractFailureAnalyzer<T extends Throwable> implements FailureAnalyzer {
    @Override
    public FailureAnalysis analyze(Throwable failure) {
        T cause = findCause(failure, getCauseType());
        if (cause != null) {
            return analyze(failure, cause);
        }
        return null;
    }
    protected abstract FailureAnalysis analyze(Throwable rootFailure, T cause);
    @SuppressWarnings("unchecked")
    protected Class<? extends T> getCauseType() {
        return (Class<? extends T>) ResolvableType.forClass(AbstractFailureAnalyzer.class, getClass()).resolveGeneric();
    }
    @SuppressWarnings("unchecked")
    protected final <E extends Throwable> E findCause(Throwable failure, Class<E> type) {
        while (failure != null) {
            if (type.isInstance(failure)) {
                return (E) failure;
            }
            failure = failure.getCause();
        }
        return null;
    }
}

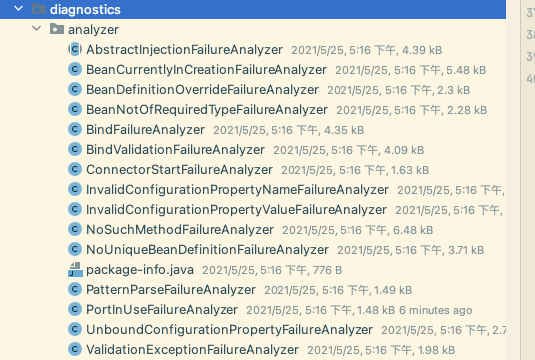
这个时候,我们是不是该想到,Spring Boot 是不是提供了很多这样的故障分析器呢?答案是肯定的,Spring Boot 提供了一系列各种不同类型的故障分析器来方便我们开发者快速定位到错误的原因。如下图所示,Spring Boot 默认提供了14种故障分析器。

spring boot failure2

这个时候我们又想了,那他又是怎么注册这些分析器到Spring Boot 项目的呢?我们已经知道 Spring Boot 大部分都是通过约定配置来实现的,我们就先找一下,有没有什么配置文件做了这个事情。通过指北君的一顿搜索操作,终于找到了。Spring Boot 内置注册的所有故障分析器在这个文件里面:

1
/org/springframework/boot/spring-boot/2.5.0.RELEASE/spring-boot-2.5.0.RELEASE-sources.jar!/META-INF/spring.factories

注册的所有故障分析器列表:

1
2
3
4
5
6
7
8
9
10
11
12
13
14
15
16
17
18
19
20
# Failure Analyzers
org.springframework.boot.diagnostics.FailureAnalyzer=\
org.springframework.boot.context.config.ConfigDataNotFoundFailureAnalyzer,\
org.springframework.boot.context.properties.IncompatibleConfigurationFailureAnalyzer,\
org.springframework.boot.context.properties.NotConstructorBoundInjectionFailureAnalyzer,\
org.springframework.boot.diagnostics.analyzer.BeanCurrentlyInCreationFailureAnalyzer,\
org.springframework.boot.diagnostics.analyzer.BeanDefinitionOverrideFailureAnalyzer,\
org.springframework.boot.diagnostics.analyzer.BeanNotOfRequiredTypeFailureAnalyzer,\
org.springframework.boot.diagnostics.analyzer.BindFailureAnalyzer,\
org.springframework.boot.diagnostics.analyzer.BindValidationFailureAnalyzer,\
org.springframework.boot.diagnostics.analyzer.UnboundConfigurationPropertyFailureAnalyzer,\
org.springframework.boot.diagnostics.analyzer.ConnectorStartFailureAnalyzer,\
org.springframework.boot.diagnostics.analyzer.NoSuchMethodFailureAnalyzer,\
org.springframework.boot.diagnostics.analyzer.NoUniqueBeanDefinitionFailureAnalyzer,\
org.springframework.boot.diagnostics.analyzer.PortInUseFailureAnalyzer,\
org.springframework.boot.diagnostics.analyzer.ValidationExceptionFailureAnalyzer,\
org.springframework.boot.diagnostics.analyzer.InvalidConfigurationPropertyNameFailureAnalyzer,\
org.springframework.boot.diagnostics.analyzer.InvalidConfigurationPropertyValueFailureAnalyzer,\
org.springframework.boot.diagnostics.analyzer.PatternParseFailureAnalyzer,\
org.springframework.boot.liquibase.LiquibaseChangelogMissingFailureAnalyzer

通过上述的一堆分析,想必大家已经清楚,FailureAnalyzer 是怎么回事了吧。接下来指北君就要带领大家一起定义一个FailureAnalzer 玩玩了。

自定义实现 FailureAnalyzer

接下来我们通过举两个例子来看看,故障分析器是怎么实现的。

1、重写端口占用故障分析器

从简单的入手,我们先重写一个 PortInUseFailureAnalyzer 看看,能不能达到我们想要的效果。

很简单,创建一个故障分析器继承 AbstractFailureAnalyzer 抽象类即可:

1
2
3
4
5
6
7
8
public class MyPortInUseFailureAnalyzer extends AbstractFailureAnalyzer<PortInUseException> {
    @Override
    protected FailureAnalysis analyze(Throwable rootFailure, PortInUseException cause) {
        return new FailureAnalysis("你启动的端口 " + cause.getPort() + " 被占用",
                "快检查下端口 " + cause.getPort() + " 被哪个程序占用",
                cause);
    }
}

重写 analyze 方法,并返回一个 FailureAnalysis 对象, FailureAnalysis 类的三个主要信息分别是:

1
2
3
4
5
public FailureAnalysis(String description, String action, Throwable cause) {
   this.description = description;
   this.action = action;
   this.cause = cause;
}

即要展示的:可读性的错误描述、建议的检查修复动作、原始异常。

然后在项目的 resouces 目录下创建 META-INF/spring.factories 文件,内容添加:

1
2
org.springframework.boot.diagnostics.FailureAnalyzer=\
  com.javanorth.failure.analyzer.sample.MyPortInUseFailureAnalyzer

启动输出:

1
2
3
4
5
6
7
8
9
10
***************************
APPLICATION FAILED TO START
***************************
Description:

你启动的端口 8080 被占用

Action:

快检查下端口 8080 被哪个程序占用

这样重写一下,是不是就感觉清晰很多了。

2、自定义故障分析器

下面我们再来自定义一个全新的故障分析器,让大家能更清楚的认识故障分析器。

我们在创建 Bean 的过程中手动抛出一个自定义的异常:

1
2
3
4
5
6
7
8
9
10
public class JavaNorthException extends Exception {
    public JavaNorthException(String message) {
        super(message);
    }
}

@Bean
public CommandLineRunner commandLineRunner() throws JavaNorthException {
    throw new JavaNorthException("Java North error.");
}

添加一个故障分析器拦截该异常:

1
2
3
4
5
6
public class JavaNorthFailureAnalyzer  extends AbstractFailureAnalyzer<JavaNorthException> {
    @Override
    protected FailureAnalysis analyze(Throwable rootFailure, JavaNorthException cause) {
        return new FailureAnalysis("java north error.", "快去检查一下吧", cause);
    }
}

添加注册:

1
2
3
org.springframework.boot.diagnostics.FailureAnalyzer=\
  com.javanorth.failure.analyzer.sample.MyPortInUseFailureAnalyzer,\
  com.javanorth.failure.analyzer.sample.JavaNorthFailureAnalyzer

启动输出:

1
2
3
4
5
6
7
8
9
10
***************************
APPLICATION FAILED TO START
***************************
Description:

java north error.

Action:

快去检查一下吧

自定义一个新的故障分析器,是不是也很简单,和重写端口占用的分析器没什么区别。同样能够更加友好的给出错误信息。

总结

Spring Boot 提供的故障分析器,对我们分析一些错误非常的友好,我们不必为那些一大堆的异常信息一筹莫展。这么好的功能,你还在等什么,还不使用吗?

本文的所有示例源代码都已上传到了 Github:

https://github.com/javatechnorth/java-north-sample

欢迎大家 Star 关注,后续会不断更新。

有任何问题可以在公众号后台留言,指北君会第一时间回复大家。欢迎关注公众号【Java技术指北】,第一时间获取更多精彩内容。

[EOF]

Java Geek Tech wechat
欢迎订阅 Java 技术指北,这里分享关于 Java 的一切。